———— Evaluation Figure Template ————
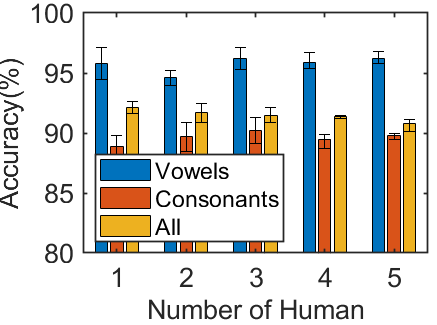
1. 分组柱状图
    %% 分组柱状图
    csv_data = [95.8	94.6	96.2    95.9    96.2
                88.9	89.7	90.2    89.5    89.8
                92.1	91.7	91.5    91.4    90.8];
    neg =[1.3000   0.6000   0.9000  0.5     0.4
        0.9000   1.2000   1.1000    0.8     0.3
        0.5000   0.8000   0.6000    0.2     0.7];
    pos =[1.3000   0.6000   0.9000  0.8     0.6
        0.9000   1.2000   1.1000    0.4     0.2
        0.5000   0.8000   0.6000    0.1     0.3];

    figure('color','w');

    h=bar(csv_data');
    % 获取误差线 x 值, 也就是 XEndPoints 的值
    xx = zeros(5, 3);
    for i = 1 : 3
        xx(:, i) = h(1, i).XEndPoints';
    end
    % 绘制误差线
    hold on
    errorbar(xx', csv_data, neg, pos, 'LineStyle', 'none', 'Color', 'k', 'LineWidth', 0.5);
    hold off

    set(gcf,'Position',[500 500 350 260]);%左下角位置,宽高
    set (gca,'position',[0.19,0.22,0.79,0.74] );%同样应用是在画图到word
    set(gca,'linewidth',1); %坐标线线宽1磅
    set(gca,'Fontname','Arial','fontsize',16); %设置坐标轴字体
    set(get(gca,'XLabel'),'FontSize',16); %x轴字体为8 point
    set(get(gca,'YLabel'),'FontSize',16); %y轴字体为8 point
    set(get(gca,'TITLE'),'FontSize',16); %标题字体为8 point
    xlabel('Number of Human','Fontname','Arial','Fontsize',16) %设置x轴的字体
    ylabel('Accuracy(%)','Fontname','Arial','Fontsize',16) %设置y轴的字体
    ylim([0,6])
    ylim([80,100])
    set(gca, 'ytick', 80:5:100)
    legend({'Vowels', 'Consonants', 'All'}, 'location','SouthWest','FontSize',14)
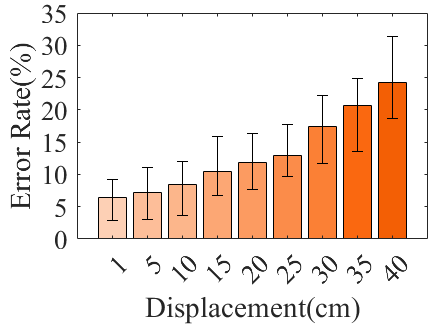
2. 渐变柱状图
    %% 渐变柱状图

    figure('color','w')
    xx = linspace(0,30,9);
    data = 100 - [93.6	92.8	91.5    89.5	88.2	87    82.6	    79.4	    75.8];
    data2 = diag(data);
    b = bar(data2,'stack');
    ch = get(b,'children');
    errlow  = [3.6000   4.2000   4.9000  3.8000   4.1000   3.3000  5.7000   7.1000   5.5000];
    errhigh = [2.8000   3.9000   3.5000  5.4000   4.5000   4.8000  4.8000   4.3000   7.2000];

    %color = [217,237,146;181, 228, 140;181, 228, 140;118, 200, 147;82, 182, 154;52, 160, 164;22, 138, 173];
    color = [253,208,181; 253,190,153; 252,182,139; 252,167,116; 252,155,97; 251,140,74; 251, 128, 53; 250,104,16; 243, 95,5];

    color2 = color / 255;
    hold on
    for i=1:9
    set(b(i),'FaceColor',color2(i,:));
    end
    %  xlim([-5,35]);
    %  ylim([0,2.5]);
    %  xlabel('Included angle (°)');
    set(gcf,'Position',[500 500 350 260]);%左下角位置,宽高
    set (gca,'position',[0.19,0.22,0.79,0.74] );%同样应用是在画图到word

    xlabel('Displacement(cm)','Fontname','Arial','Fontsize',16) %设置x轴的字体为新罗马体,大小为8points
    ylabel('Error Rate(%)','Fontname','Arial','Fontsize',16) %设置y轴的字体为宋体,大小为8points
    set(gca,'FontName','Arial','FontSize',16);
    %  set(gca, 'FontName', 'Arial');

    % 获取误差线 x 值,也就是 XEndPoints 的值
    xx = b(1, i).XEndPoints;

    % 绘制误差线
    hold on
    errorbar(xx, data, errlow, errhigh, 'LineStyle', 'none', 'Color', 'k', 'LineWidth', 0.5);
    hold off

    ylim([0,35])
    set(gca, 'ytick', 0:5:35)
    xlim([0,10])
    set(gca, 'xtick', 1:1:9)

    set(gca,'xticklabel',{'1', '5',  '10', '15',  '20', '25',  '30', '35',  '40'},'FontSize',16);
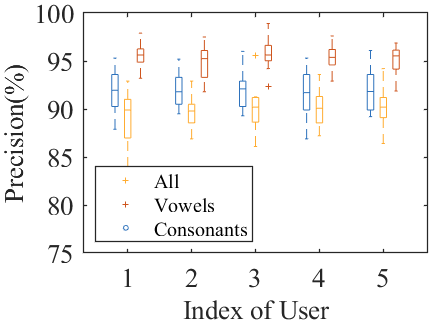
3. 分组箱线图
    % USer1, USer2, USer3, USer4, USer5,
    precesionA = [93.1	90.1	93.1	93.1	92.5
                95.3	91.3	91.63	95.3	96.1
                93.59	95.2	92.59	93.59	93.59
                94.56	93.3	92.56	94.56	94.56
                90.26	92.3	90.26	90.26	90.26
                87.89	93.3	89.3	86.89	89.89
                89.69	89.5	89.69	89.69	89.69
                90.5	90.5	90.5	90.5	91.15
                92.9	92.9	92.9	92.9	92.9
                91	    91.3	96	    89.9	89.21];

    precesionV = [96.1	96.1	98.1	93.1	95.5
                96.86	95.3	96.63	97.31	96.87
                94.88	97.5	96.48	94.59	96.59
                95.56	93.3	94.2	95.56	95.56
                96.26	96.3	95.66	95.26	95.26
                95.2	94.3	95.02	96.2	96.13
                95.69	91.8	92.31	94.69	95.69
                94.5	95.9	95.5	95.5	94.15
                97.9	92.9	98.9	92.9	92.9
                93.2	95.2	95.6	97.6	91.88];

    precesionC = [90.1	83.1	86.1	92.5	91.5
                91.63	89.3	88.63	91.3	89.8
                89.59	90.59	90.48	93.59	94.2
                84.56	88.56	91.2	88.56	88.9
                82.26	90.26	91.26	90.26	89.4
                86.98	86.89	89.02	89.89	91.2
                89.69	89.69	88.31	89.69	86.4
                90.5	90.5	90.5	88.15	91.1
                92.9	92.9	89.9	90.9	90.6
                91	    89.9	95.6	87.21	89.1];

    figure('color','w')

    %boxcolor = [206, 85, 30]/255;
    %boxfillcolor = [230, 145, 100]/255;
    %boxchart(csv_data, 'LineWidth',1, 'BoxFaceColor',boxfillcolor, 'WhiskerLineColor', boxcolor, 'WhiskerLineStyle','-','BoxWidth', 0.75)

    color1=[46, 114, 188]/255;
    color2=[206, 85, 30]/255;
    color3=[255, 172, 49]/255;
    position_1 = [0.8:1:4.8];  % define position for first boxplots
    position_2 = [1.0:1:5.0];  % define position for second boxplots
    position_3 = [1.2:1:5.2];  % define position for second boxplots

    h1=boxplot(precesionA, 'Positions', position_1, 'colors',color1,'Width', 0.1,'symbol','o','outliersize',3);
    hold on;
    h2=boxplot(precesionV, 'Positions', position_3, 'colors',color2, 'Width', 0.1, 'symbol','+','outliersize',3);
    hold on;
    h3=boxplot(precesionC, 'Positions', position_2, 'colors',color3, 'Width', 0.1, 'symbol','+','outliersize',3);

    % 设置箱线宽1.5
    set(h1,'LineWidth',1.5);
    set(h2,'LineWidth',1.5);
    set(h3,'LineWidth',1.5);

    boxchi = get(gca, 'Children');
    legend([boxchi(1),boxchi(2),boxchi(3)], ["All", "Vowels","Consonants"],'location','SouthWest','FontSize',12 );
    box on

    set(gcf,'Position',[500 500 350 260]);%左下角位置,宽高
    set (gca,'position',[0.19,0.22,0.79,0.74] );%同样应用是在画图到word
    set(gca,'linewidth',0.75); %坐标线线宽1磅
    set(gca,'Fontname','Arial','fontsize',16); %设置坐标轴字体为新罗马字体,大小为8 point或小5号
    set(get(gca,'XLabel'),'FontSize',16); %x轴字体为8 point
    set(get(gca,'YLabel'),'FontSize',16); %y轴字体为8 point
    set(get(gca,'TITLE'),'FontSize',16); %标题字体为8 point
    xlabel('Index of User','Fontname','Arial','Fontsize',16) %设置x轴的字体为新罗马体,大小为8points
    ylabel('Precision(%)','Fontname','Arial','Fontsize',16) %设置y轴的字体为宋体,大小为8points
    ylim([75,100])
    set(gca, 'ytick', 75:5:100)
    %set(gca,'xticklabel',{'User1', 'User2', 'User3', 'User4', 'User5'},'FontSize',16);
    % set(gca, 'xtick', x)
    % y=[80, 85, 90, 95, 100]
    % set(gca, 'ytick', y)
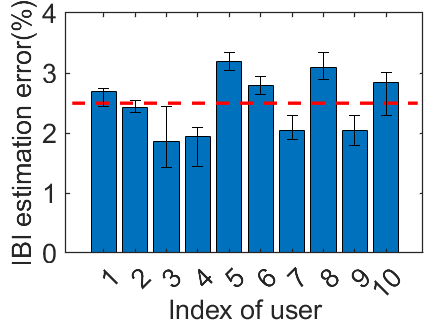
4. 带误差棒的柱状图
    %%
    IBI_Error = [5.38   4.85   3.71    3.9     6.4     5.6    4.1     6.2     4.1     5.7] ./2;
    IBI_Error_min = [4.9    4.7     4.56    4.9     6.1     5.3   3.8     5.8     4.6     4.6]./2;
    IBI_Error_max = [5.5    5.1     4.9     4.2     6.7     5.9    4.6     6.7     4.6     6.01]./2;
    neg = abs(IBI_Error - IBI_Error_min);
    pos = abs(IBI_Error - IBI_Error_max);
    IBI_Error_mean = mean(IBI_Error)

    user_index = [1, 2, 3, 4, 5, 6, 7, 8, 9, 10];


    figure('color','w')
    boxcolor = [46, 114, 188]/255;

    bar(user_index, IBI_Error)
    hold on
    line([0,11],[IBI_Error_mean, IBI_Error_mean],'linestyle','--', 'LineWidth', 2, 'Color', 'r');

    %text(5, IBI_Error_mean + 0.5,'average error', 'Color','r', FontSize=16)

    %绘制误差线
    hold on
    errorbar(user_index, IBI_Error, neg, pos, 'LineStyle', 'none', 'Color', 'k', 'LineWidth', 0.5);
    hold off

    set(gcf,'Position',[500 500 350 260]);%左下角位置,宽高
    set (gca,'position',[0.15,0.22,0.82,0.74] );%同样应用是在画图到word
    set(gca,'linewidth',0.75); %坐标线线宽1磅
    set(gca,'Fontname','Arial','fontsize',16); %设置坐标轴字体为新罗马字体,大小为8 point或小5号
    set(get(gca,'XLabel'),'FontSize',16); %x轴字体为8 point
    set(get(gca,'YLabel'),'FontSize',16); %y轴字体为8 point
    set(get(gca,'TITLE'),'FontSize',16); %标题字体为8 point
    xlabel('Index of user','Fontname','Arial','Fontsize',16) %设置x轴的字体为新罗马体,大小为8points
    ylabel('IBI estimation error(%)','Fontname','Arial','Fontsize',16) %设置y轴的字体为宋体,大小为8points
    ylim([0,4])
    set(gca, 'ytick', 0:1:4)
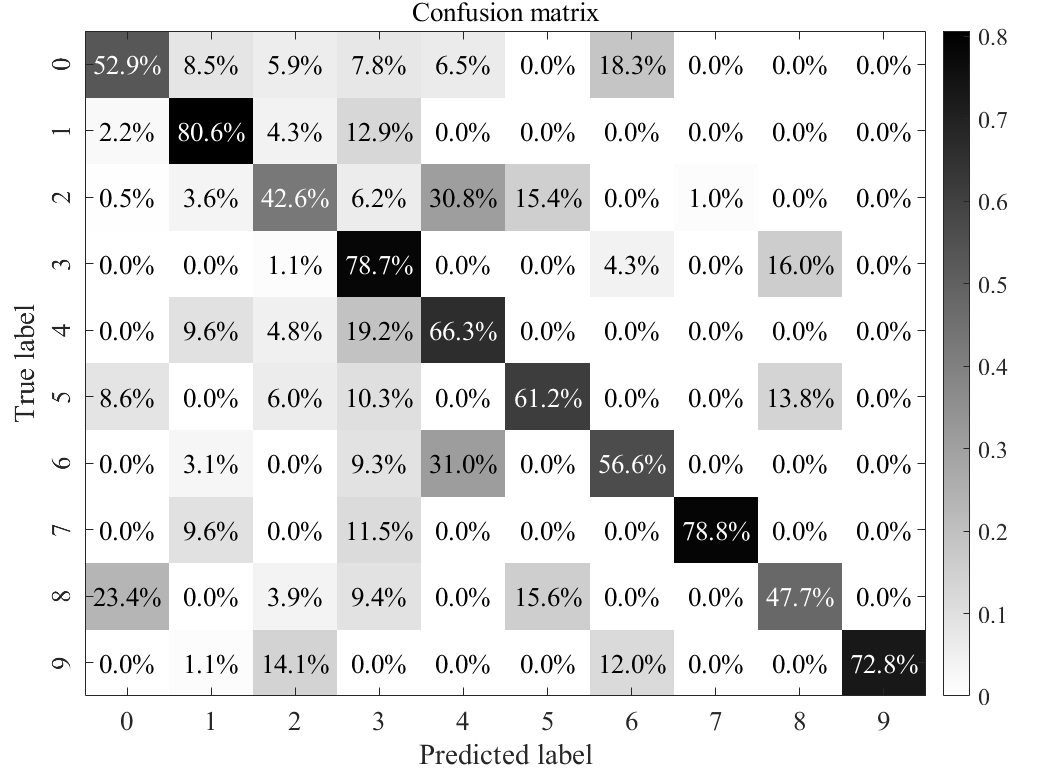
5. 混淆矩阵
    %% 1. main funciton
    LoS = [0.81    0.12   0.19    0.12    0.09    0    0   0   0   0;
            0.01    0.75   0.19    0.12    0.09    0    0   0   0   0;
            0.11    0.3   0.83    0.12    0.09    0    0   0   0   0;
            0.08    0.3   0.19    0.74    0.09    0    0   0   0   0;
            0.07    0.3   0.19    0.12    0.69    0    0   0   0   0;
            0.12    0.3   0.19    0.12    0.09    0.71    0   0   0   0;
            0.06    0.3   0.19    0.12    0.09    0    0.73   0   0   0;
            0.04    0.3   0.19    0.12    0.09    0    0   0.82   0   0;
            0.03    0.3   0.19    0.12    0.09    0    0   0   0.61   0;
            0.06    0   0   0     0     0            0    0   0   0.67  ];
    % LoS 绘制混淆矩阵
    %confusion_matrix_plot(LoS)


    NLoS = [0.81    0.13   0.09    0.12    0.1    0    0.28   0   0   0;
            0.02    0.75   0.04    0.12    0.0    0    0   0   0   0;
            0.01    0.07   0.83    0.12    0.6    0.3    0   0.02   0   0;
            0.0    0.00   0.01    0.74    0.0    0    0.04   0   0.15   0;
            0.0    0.10   0.05    0.2     0.69   0    0   0   0   0;
            0.1    0.00   0.07    0.12    0.0    0.71    0   0   0.16   0;
            0.0    0.04   0.00    0.12    0.4    0    0.73   0   0   0;
            0.0    0.10   0.00    0.12    0.0    0    0   0.82   0   0;
            0.3    0.00   0.05    0.12    0.0    0.2    0   0   0.61   0;
            0.0    0.01   0.13    0       0      0    0.11    0   0   0.67  ];
    % NLoS 绘制混淆矩阵
    confusion_matrix_plot(NLoS)


    %% 2 混淆矩阵函数
    %==================================
    % Function: 绘制给定矩阵的混淆矩阵
    % Author: XYZBY
    % Time: 2021.03.16
    % Ref: 1. https://www.codetd.com/article/27347
    %      2. https://blog.csdn.net/zhaomengszu/article/details/56283832
    %      3. https://mathpretty.com/10675.html (python下的绘制)
    % Example:
    %        mat=randi([1,10],5,5);
    %        confusion_matrix_plot(mat)
    %==================================
    function confusion_matrix_plot(mat)

    is_normalize=true; % 该参数决定是否采用百分数显示,默认false,即显示原始数据(整数)
                        % PS. 我想写默认参数的,然而matlab不支持,哭辽~~

    if is_normalize
        mat=mat./(sum(mat,2));  % 按行缩放到[0, 1]内
    end

    % 简单检查输入
    if size(mat,1)~=size(mat,2)
        error("Error occurred: Wrong input!")
    end
    % 输入矩阵大小为dim*dim
    dim=size(mat,1);

    % imagesc()根据矩阵值绘制热力图(有颜色的网格图)
    imagesc(mat);
    % 显示图右侧的色图(colormap),默认高值是白色,因此需要反转函数flipud()使高值为黑
    colormap(flipud(gray));

    % 将数值矩阵转为字符串矩阵,方便后续在图中方格中心处显示
    if ~is_normalize
        textStrings = num2str(mat(:),'%d');
    else
    %     textStrings = num2str(mat(:),'%.4f'); % 小数形式显示

        textStrings = num2str(mat(:).*100,'%.1f'); % 百分数形式显示
        textStrings=strcat(textStrings,{'%'});  % 添加百分号
    end
    % 去除字符串首尾的空格
    textStrings = strtrim(cellstr(textStrings));


    % 网格采样点函数mashgrid(),用来确定字符串显示位置
    [x,y] = meshgrid(1:dim);
    % 用text()指定输出字符串的位置等属性
    hStrings = text(x(:),y(:),textStrings(:),'HorizontalAlignment',...
        'center','FontSize',16,'Fontname', 'Times New Roman');
    % 通过判断网格填充色偏白/偏黑来自动选择字符串的颜色为黑色/白色,避免与网格背景相近
    textColors = repmat(mat(:) > mean(get(gca,'CLim')),1,3);
    % 改变各字符串颜色
    set(hStrings,{'Color'},num2cell(textColors,2));

    % 设置一些显示属性
    set(gca,'xtick',1:dim,...
        'xticklabel',{'0','1','2','3','4','5','6','7','8','9'},... %设置横轴标签,
        ...  % 如果标签过长,可添加“'XTickLabelRotation',45”以旋转45°
        'ytick',1:dim,...
        'yticklabel',{'0','1','2','3','4','5','6','7','8','9'},...  %设置纵轴
        'YTickLabelRotation',90,...  % 标签旋转90°,也可使用ytickangle(90);
        'FontSize',16,'Fontname', 'Times New Roman');%设置坐标系的数字大小
    set(gca,'Fontname','Times New Roman','fontsize',16); %设置坐标轴字体为新罗马字体,大小为8 point或小5号
    set(get(gca,'XLabel'),'FontSize',16); %x轴字体为8 point
    set(get(gca,'YLabel'),'FontSize',16); %y轴字体为8 point
    set(get(gca,'TITLE'),'FontSize',16); %标题字体为8 point
    xlabel('Index of user','Fontname','Times New Roman','Fontsize',16) %设置x轴的字体为新罗马体,大小为8points
    ylabel('IBI estimation error(%)','Fontname','Times New Roman','Fontsize',16) %设置y轴的字体为宋体,大小为8points

    title('Confusion matrix');
    ylabel('True label');
    xlabel('Predicted label');
    % 产生色图
    colorbar;
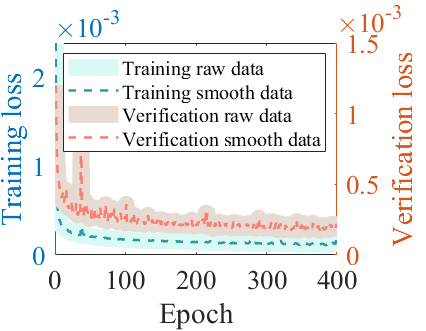
6. 双坐标曲线
    %%
    figure('color','w')

    yyaxis left

    loss_data= csvread('train_smooth.csv',1);
    select = 1:1:400;
    step = loss_data(select,2);
    loss_value = loss_data(select,3);

    loss_data_raw = csvread('train_org.csv',1);
    step_raw = loss_data_raw(select,2);
    loss_value_raw = loss_data_raw(select,3);

    raw = plot(step_raw, (1*loss_value_raw),color=[219, 249, 244]/255, LineWidth=10);
    hold on;
    smooth = plot(step, (1*loss_value), color=[48, 151, 164]/255, LineWidth=1.5);

    %set(gcf, 'unit', 'centimeters', 'position', [10, 10, 9, 7])
    set(gcf,'Position',[500 500 350 260]);%左下角位置,宽高
    set (gca,'position',[0.13,0.23,0.66,0.64] );%同样应用是在画图到word
    set(gca, 'Fontname', 'Times New Roman', 'fontsize', 16);
    set(get(gca, 'XLabel'), 'FontSize', 16);
    set(get(gca, 'YLabel'), 'FontSize', 16);
    legend({'Raw', 'Smooth'}, 'location', 'northeast', 'FontSize', 12)

    ylabel('Training loss')


    %%
    yyaxis right

    loss_data= csvread('val_smooth.csv',1);
    select = 1:1:400;
    step = loss_data(select,2);
    loss_value = loss_data(select,3);

    loss_data_raw = csvread('val_org.csv',1);
    step_raw = loss_data_raw(select,2);
    loss_value_raw = loss_data_raw(select,3);

    raw = plot(step_raw, (1*loss_value_raw),color=[231 218 210]/255, LineWidth=10);
    hold on;
    smooth = plot(step, (1*loss_value), color=[250 127 111]/255, LineWidth=1.5);

    set(gcf, 'unit', 'centimeters', 'position', [10, 10, 9, 7])
    set(gca, 'Fontname', 'Times New Roman', 'fontsize', 16);
    set(get(gca, 'XLabel'), 'FontSize', 16);
    set(get(gca, 'YLabel'), 'FontSize', 16);

    ylabel('Verification loss')

    xlabel('Epoch')
    set(gca, 'xtick', 0:100:400)
    legend({'Training raw data', 'Training smooth data', 'Verification raw data', 'Verification smooth data'}, 'location', 'northeast', 'FontSize', 12)
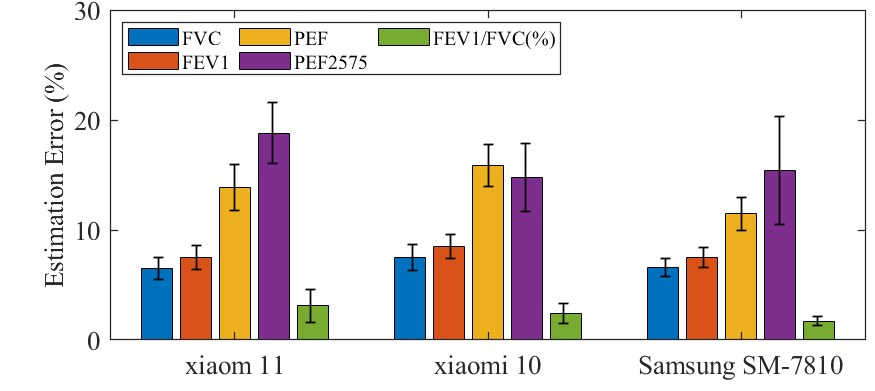
7. 分5组柱状图
%%
% 相对误差
data = [6.49, 7.51, 13.83, 18.8, 3.12;
        7.49, 8.51, 15.83, 14.8, 2.41;
        6.6,  7.5,  11.5, 15.4,  1.7 ];
err_sem = [0.99, 1.08, 2.1,  2.75, 1.51;
           1.2, 1.1, 1.9, 3.1, 0.9;
           0.8, 0.9, 1.5, 4.9, 0.4];

figure('color','w')

barWidth = 0.8;
h=bar(data, barWidth);

hold on
errorbar([0.7,1.7,2.7], data(:,1), err_sem(:,1),'LineStyle', 'none', 'Color', 'k', 'LineWidth', 1)
hold on
errorbar([0.85,1.85, 2.85], data(:,2), err_sem(:,2),'LineStyle', 'none', 'Color', 'k', 'LineWidth', 1)
hold on
errorbar([1,2,3], data(:,3), err_sem(:,3),'LineStyle', 'none', 'Color', 'k', 'LineWidth', 1)
hold on
errorbar([1.15,2.15, 3.15], data(:,4), err_sem(:,4),'LineStyle', 'none', 'Color', 'k', 'LineWidth', 1)
hold on
errorbar([1.3, 2.3, 3.3], data(:,5), err_sem(:,5),'LineStyle', 'none', 'Color', 'k', 'LineWidth', 1)

set(gcf, 'unit', 'centimeters', 'position', [10, 10, 9, 7])

% set(h(1), 'FaceColor', color1)
% set(h(2), 'FaceColor', color2)
set(gca, 'linewidth', 0.75);
set(gca, 'Fontname', 'Times New Roman', 'fontsize', 16);
set(get(gca, 'XLabel'), 'FontSize', 16);
set(get(gca, 'YLabel'), 'FontSize', 16);
set(get(gca, 'TITLE'), 'FontSize', 16);
set(gca,'position',[0.088908023918225,0.09906695386102,0.901091976081776,0.875933046138979])
set(gca, 'XTickLabel', {'xiaom 11', 'xiaomi 10', 'Samsung SM-7810'},'FontSize', 16, 'FontName', 'Times New Roman')
%set(gca, 'YGrid', 'on')
%xlabel('Metrics', 'Fontname','Times New Roman', 'Fontsize',16)
ylabel('Estimation Error (%)', 'Fontname','Times New Roman', 'Fontsize',16)
ylim([0,30])
%set(gca, 'ytick', 0:2:8)

% yticks([0:5:40]);

legend({'FVC', 'FEV1', 'PEF', 'PEF2575', 'FEV1/FVC(%)'}, 'location', 'NorthWest','NumColumns',3, 'FontSize', 12)
8. 分4组柱状图
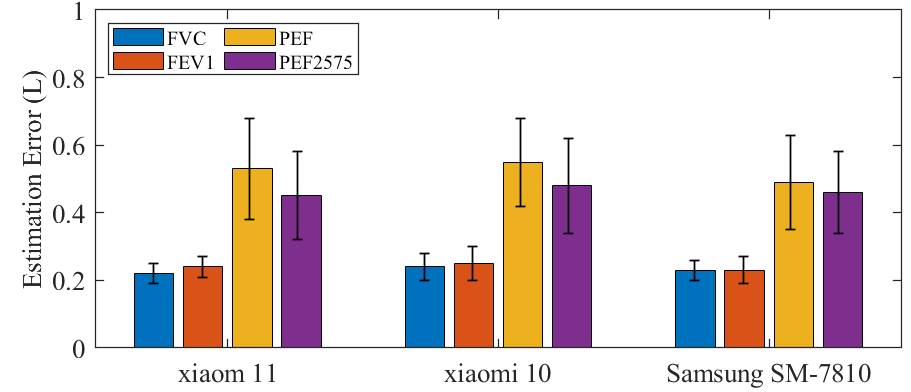
% 绝对误差
x = 1:4;
data = [0.22, 0.24, 0.53, 0.45;
        0.24, 0.25, 0.55, 0.48;
        0.23, 0.23, 0.49, 0.46];
err_sem = [0.03, 0.03, 0.15, 0.13;
           0.04, 0.05, 0.13, 0.14;
           0.03, 0.04, 0.14, 0.12];

figure('color','w')

barWidth = 0.8;
h=bar(data, barWidth);

hold on
errorbar([0.725,1.725,2.725], data(:,1), err_sem(:,1),'LineStyle', 'none', 'Color', 'k', 'LineWidth', 1)
hold on
errorbar([0.905,1.905, 2.905], data(:,2), err_sem(:,2),'LineStyle', 'none', 'Color', 'k', 'LineWidth', 1)
hold on
errorbar([1.08,2.08, 3.08], data(:,3), err_sem(:,3),'LineStyle', 'none', 'Color', 'k', 'LineWidth', 1)
hold on
errorbar([1.258, 2.258, 3.258], data(:,4), err_sem(:,4),'LineStyle', 'none', 'Color', 'k', 'LineWidth', 1)


set(gcf, 'unit', 'centimeters', 'position', [10, 10, 9, 7])
set(gca, 'linewidth', 0.75);
set(gca, 'Fontname', 'Times New Roman', 'fontsize', 16);
set(get(gca, 'XLabel'), 'FontSize', 16);
set(get(gca, 'YLabel'), 'FontSize', 16);
set(get(gca, 'TITLE'), 'FontSize', 16);
set(gca,'position',[0.104406130268199,0.111607142857143,0.885593869731801,0.863392857142859])
set(gca, 'XTickLabel', {'xiaom 11', 'xiaomi 10', 'Samsung SM-7810'},'FontSize', 16, 'FontName', 'Times New Roman')
%set(gca, 'YGrid', 'on')
%xlabel('Metrics', 'Fontname','Times New Roman', 'Fontsize',16)
ylabel('Estimation Error (L)', 'Fontname','Times New Roman', 'Fontsize',16)
ylim([0, 1])
%set(gca, 'ytick', 0:2:8)

% yticks([0:5:40]);

legend({'FVC', 'FEV1', 'PEF', 'PEF2575'}, 'location', 'NorthWest','NumColumns',2, 'FontSize', 12)
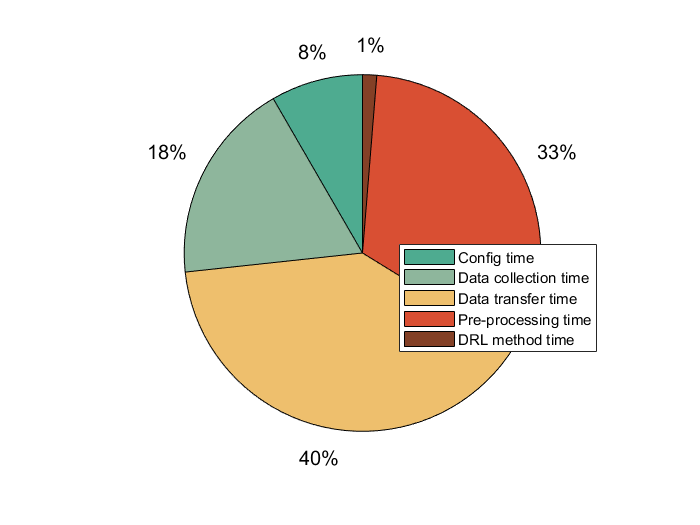
9. 饼状图
    figure(1)
    % 各个步骤的耗时:总时间:128.05s
    % config TxBF,耗时:15s
    % Data collection: 30s呼吸数据,耗时:33s
    % 30s呼吸数据(400M),实时传输(传输速率5.6M/s)耗时:71.4s
    % Matlab预处理耗时:58.43s
    % 强化学习推理一步耗时:2.3s,推理一步1e-3s,加载数据:8s
    time_efficiency = [15, 33, 71, 58.43, 2.3];
    labels = {'Config time','Data collection time', 'Data transfer time','Pre-processing time', 'DRL method time'};
    cm = [[78 171 144]/255; [142 182 156]/255; [237 221 195]/255; [238 191 109]/255; [217 79 51]/255; [131 64 38]/255;];
    colormap(cm)
    p = pie(time_efficiency);
    set(findobj(gca, 'Type', 'Text'), 'FontSize', 12);
    % 添加图例
    legend(labels, 'Location', 'eastoutside');